Main Street Markham
Download the Full Report
Visitor Summary
8.0 M
Total Number of Visitors
402.8 K
Number of Unique Visitors
Average Visit/Visitor | Average Visitors/Month | Average Visits/Month | Weekday Visits/Total Visits | Weekend Visits/Total Visits |
|---|---|---|---|---|
19.9 | 33.6 K | 667.1 K | 70% | 30% |
Visitor Demographic
Intergenerational and Multicultural Families
Diverse culture with mix of immigrant and/or Canadian-born backgrounds
Flourishing East Asian Community
Primarily first-generation immigrants from China and Hong Kong, moved to Markham in 1990s/2000s
Thriving South Asian Community
Primarily first-generation immigrants from India or Sri Lanka
Resting and
Retired
Older, long-time Markham residents
Main Street Markham is visited by a multi-cultural demographic. An average family visiting this area can be sampled as a financially secure family, which is fairly large and lives in a sub-urban part of the city. Majority of the visitors are of Asian descent.
% of Visits by Unique Visitors (Weekly)
Saturday is usually the busiest day in Markham Main Street – where the largest number of visitors come down. Friday, Wednesday and Thursday come close. A snapshot of the visitor data also reveals that the average household income of the visiting families is ~CAD $128K, and the average age range of the visitors is between 45-54 (above middle-aged population).
Demographic Summary of Unique Visitors
$128 K
Average Household Income
45 to 54
Maintainer Age
60%
Households with Children
4+ People
Household Size
University
Education
High
Cultural Diversity
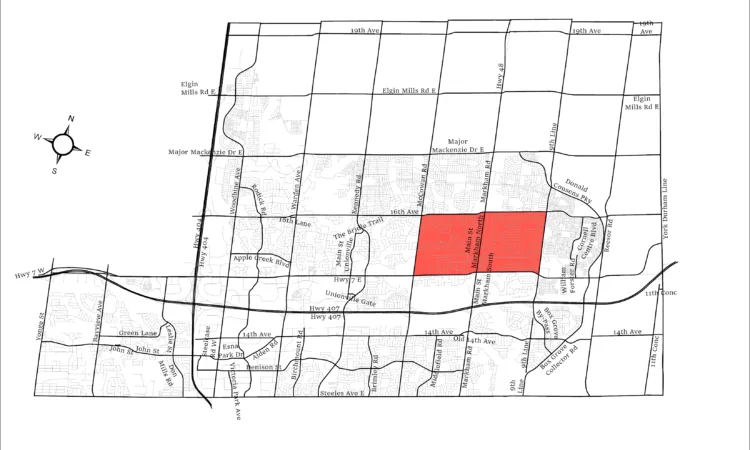
A Geographic Summary
L3P, L6E and L6B are the three most FSAs in Markham Main Street with respect to volume of visits by unique visitors in Markham – getting in 1,599,081; 1,092,056 and 1,034,937 visitors respectively.
35%
70%
Media and Spending Habits
Media Usage Snapshot
Form of Media | Usage | Used For |
|---|---|---|
| Internet | 370 min/day | Extensively used for:
|
| Television | 162 min/day | Extensively viewed:
|
| Radio | 8 hours/week | Extensively heard:
|
| Direct/Outdoor | 10 min/day (commuting one way by car) | Top DM formats used were:
|
| Magazine | 4 min/day | Top genre read was about food |
| Newspaper | 0.5 hours/week | Extensively read sections:
|
Social Media Applications
Facebook (74.6%), WhatsApp (78.4%) and YouTube (78.4%) have been the most popular social media websites in Markham Main Street in 2022.
WhatsApp and YouTube were the most used social media applications in Markham Main Street.

Top Restaurant Types in Markham
- While Pizza Restaurants (60.7%), Asian Restaurants (50.2%) and Chicken Restaurants (38.5%) were the most ordered from restaurants last year based on volume, Mexican Burrito Styled Restaurants (30.3%), Asian Restaurants (50.2%) and Pizza Restaurants (60.7%) were the top kinds of restaurants ranked by index.
- Fast Casual Restaurants (41.9%), Casual Family Dining Restaurants (36.7%) and Food Courts (33.7%) were the top restaurant service types based on volume. Fast Casual Restaurants (41.9%), Food Courts (33.7%) and Sports Bars (19.3%) were the top restaurant service types based on index.
- While Take Out (72.9%), Drive Through (46.6%) and Home Delivery (31.2%) were the top food ordering methods based on volume of food, Online Meal Kit (8.3%), Drive Through (46.6%) and Online Food Delivery Service (22.3%) were the top ordering food methods based on index.