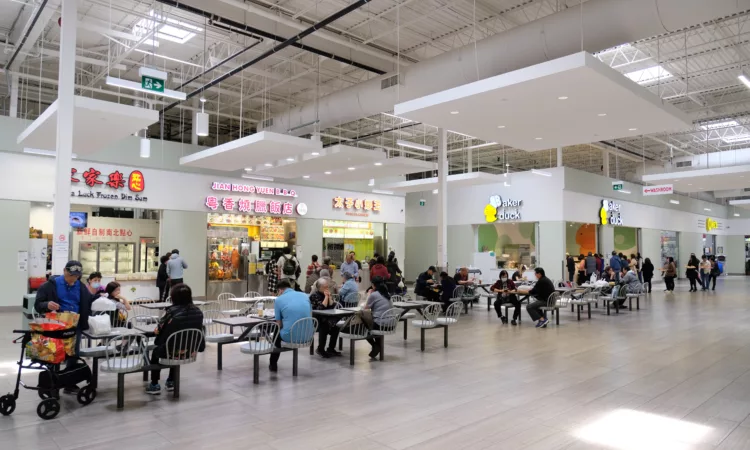
Pacific Mall and Milliken
Download the Full Report
Visitor Summary
10 M
Total Number of Visitors
592.3 K
Number of Unique Visitors
Average Visit/Visitor | Average Visitors/Month | Average Visits/Month | Weekday Visits/Total Visits | Weekend Visits/Total Visits |
|---|---|---|---|---|
16.8 | 49.9 K | 830.9 K | 66% | 34% |
Visitor Demographic
Young Singles
and Couples
Highly educated, working professional. Primarily of East Asian descent
Intergenerational and Multicultural Families
Diverse culture with mix of immigrant and/or Canadian-born backgrounds
Flourishing East Asian Community
Primarily first-generation immigrants from China and Hong Kong, moved to Markham in 1990s/2000s
Thriving South Asian Community
Primarily first-generation immigrants from India or Sri Lanka
Pacific Mall and Milliken is visited by
% of Visits by Unique Visitors (Weekly)
Pacific Mall and Milliken is visited by a multicultural demographic. An average family visiting this area can be sampled as a financially secure family, which is large and lives in a sub-urban part of the city. Most of the demographic also consists of younger singles and couples who have higher levels of university degrees. A large demographic is also from a South Asian descent.
Demographic Summary of Unique Visitors
$120 K
Average Household Income
35 to 44
Maintainer Age
54%
Households with Children
4+ People
Household Size
University
Education
High
Cultural Diversity
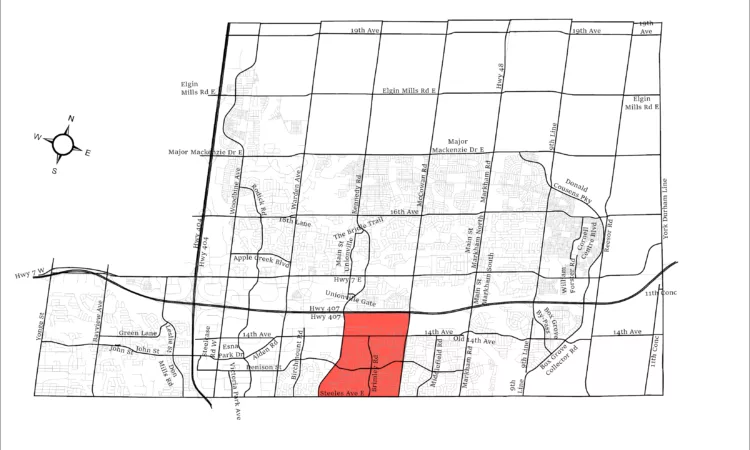
A Geographic Summary
L3R, L3S and M1V are the three most FSAs in Pacific Mall and Milliken with respect to volume of visits by unique visitors in Markham – getting in 1,458,702; 863,482 and 697,120 visitors respectively.
35%
70%
Media and Spending Habits
Media Usage Snapshot
Form of Media | Usage | Used For |
|---|---|---|
| Internet | 368 min/day | Extensively used for:
|
| Television | 167 min/day | Extensively viewed:
|
| Radio | 9 hours/week | Extensively heard:
|
| Direct/Outdoor | 10 min/day (commuting one way by car) | Top DM formats used were:
|
| Magazine | 5 min/day | Top genre read was about food |
| Newspaper | 0.6 hours/week | Extensively read sections:
|
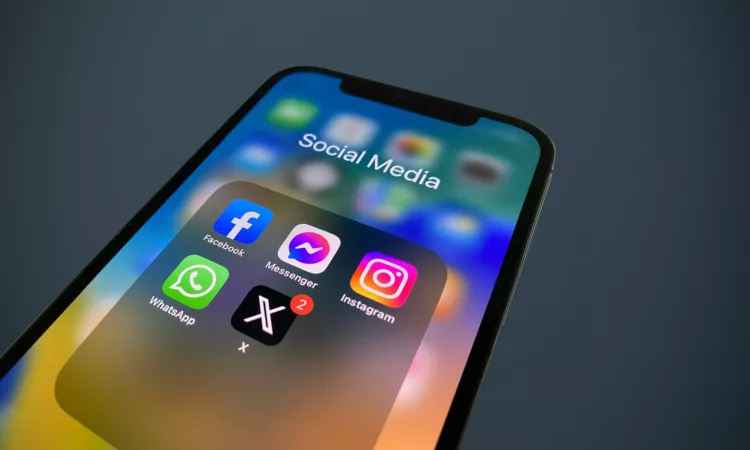
Social Media Applications
Facebook (72.9%), WhatsApp (79.1%) and YouTube (77.9%) have been the most popular social media websites in Pacific Mall and Milliken Area in 2022.
WhatsApp was the most used social media application in the Pacific Mall and Milliken Area, with people using it nearly on the same lines as the benchmark across Markham.
Top Restaurant Types in Markham
- While Pizza Restaurants (60.2%), Asian Restaurants (48.6%), and Chicken Restaurants (38%) were the most ordered from restaurants last year based on volume, Mexican Burrito Styled Restaurants (28.8%), Asian Restaurants (48.6%), and Ice Cream/Frozen Yogurt Places (31.7%) were the top kinds of restaurants ranked by index.
- Fast Casual Restaurants (40.6%), Casual Family Dining Restaurants (35.8%), and Food Courts (34%) were the top restaurant service types based on volume. Fast Casual Restaurants (40.6%), Food Courts (34%), and Sports Bars (19.6%) were the top restaurant service types based on index.
- While Take Out (72.5%), Drive Through (44%), and Home Delivery (30.4%) were the top food ordering methods based on volume of food. Online Meal Kit (8.9%), Drive Through (44%), and Take Out (72.5%) were the top ordering food methods based on index.